apm

7 Microservice Best Practices for Developers

September 27, 2021

Unless you’ve been developing software in a cave, you’ve probably heard people sing the praises of microservices. They’re agile, simple, and an overall improvement on the monolith and service-oriented architecture days. But of course, with all the benefits of microservices comes a new set of challenges.

Continue reading

4 Key Observability Metrics for Distributed Applications

July 26, 2021

A common architectural design pattern these days is to break up an application monolith into smaller microservices. Each microservice is then responsible for a specific aspect or feature of your app. For example, one microservice might be responsible for serving external API requests, while another might handle data fetching for your frontend.

Continue reading

7 Ways to Optimize Python Performance Using APM

August 19, 2019

Your website performance is critical for success. Poor page load times and responsiveness can lead to lost sales, lost ranking on search engines like Google, frustrated customers, and more. Even beyond that, inefficient code can increase infrastructure costs and potentially even affect the ability of your business to scale. We’ll discuss how to run high(er) performance Python for web applications using the popular Django framework. We’ll cover some of the common problems and patterns so you know what to look for.

Continue reading

Using Prometheus with AppOptics

October 18, 2018

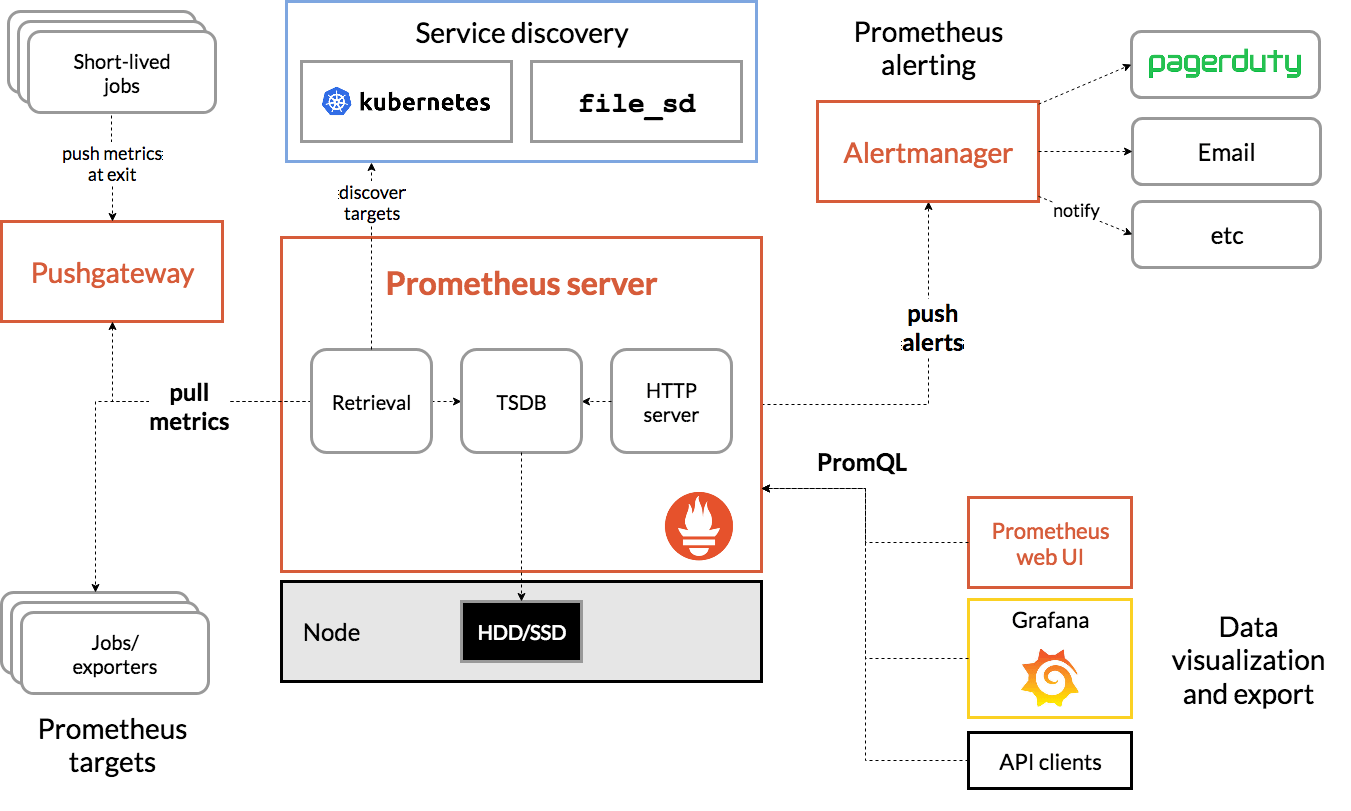
Prometheus is an all-in-one, open-source monitoring solution. While metrics are commonly visualized using Grafana, a commercial application monitoring solution like AppOptics™ can offer extra functionality. In this article, we will take a look at setting up a simple web service, using Prometheus to gather metrics, and using AppOptics to display those metrics and fire an alert.

Continue reading

How To Troubleshoot HTTP Errors With SolarWinds Cloud Monitoring Tools

October 17, 2018

It’s important to get alerts when your site has a spike in HTTP errors so your team has immediate visibility. Resolving this issue quickly can minimize the impact on customer experience and revenue. Having the right tools in place can reduce your mean time to resolution (MTTR), pay off your investment quickly, and earn praise from your operations team, leading to more satisfied customers.

Continue reading

Introduction to Distributed Tracing with Zipkin and Jaeger

October 10, 2018

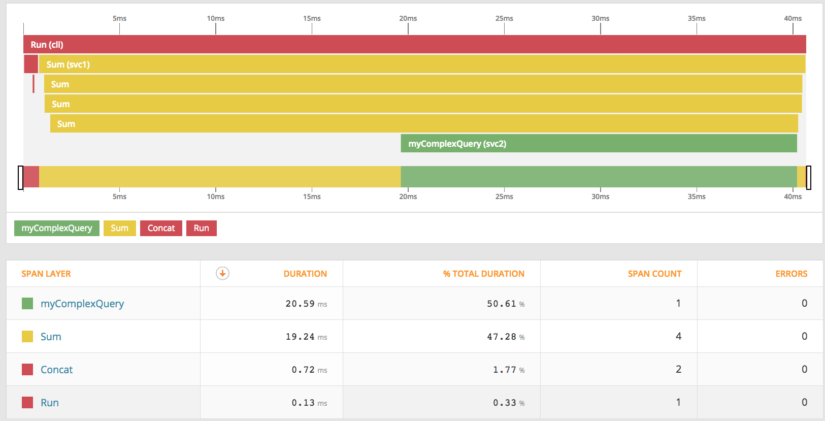
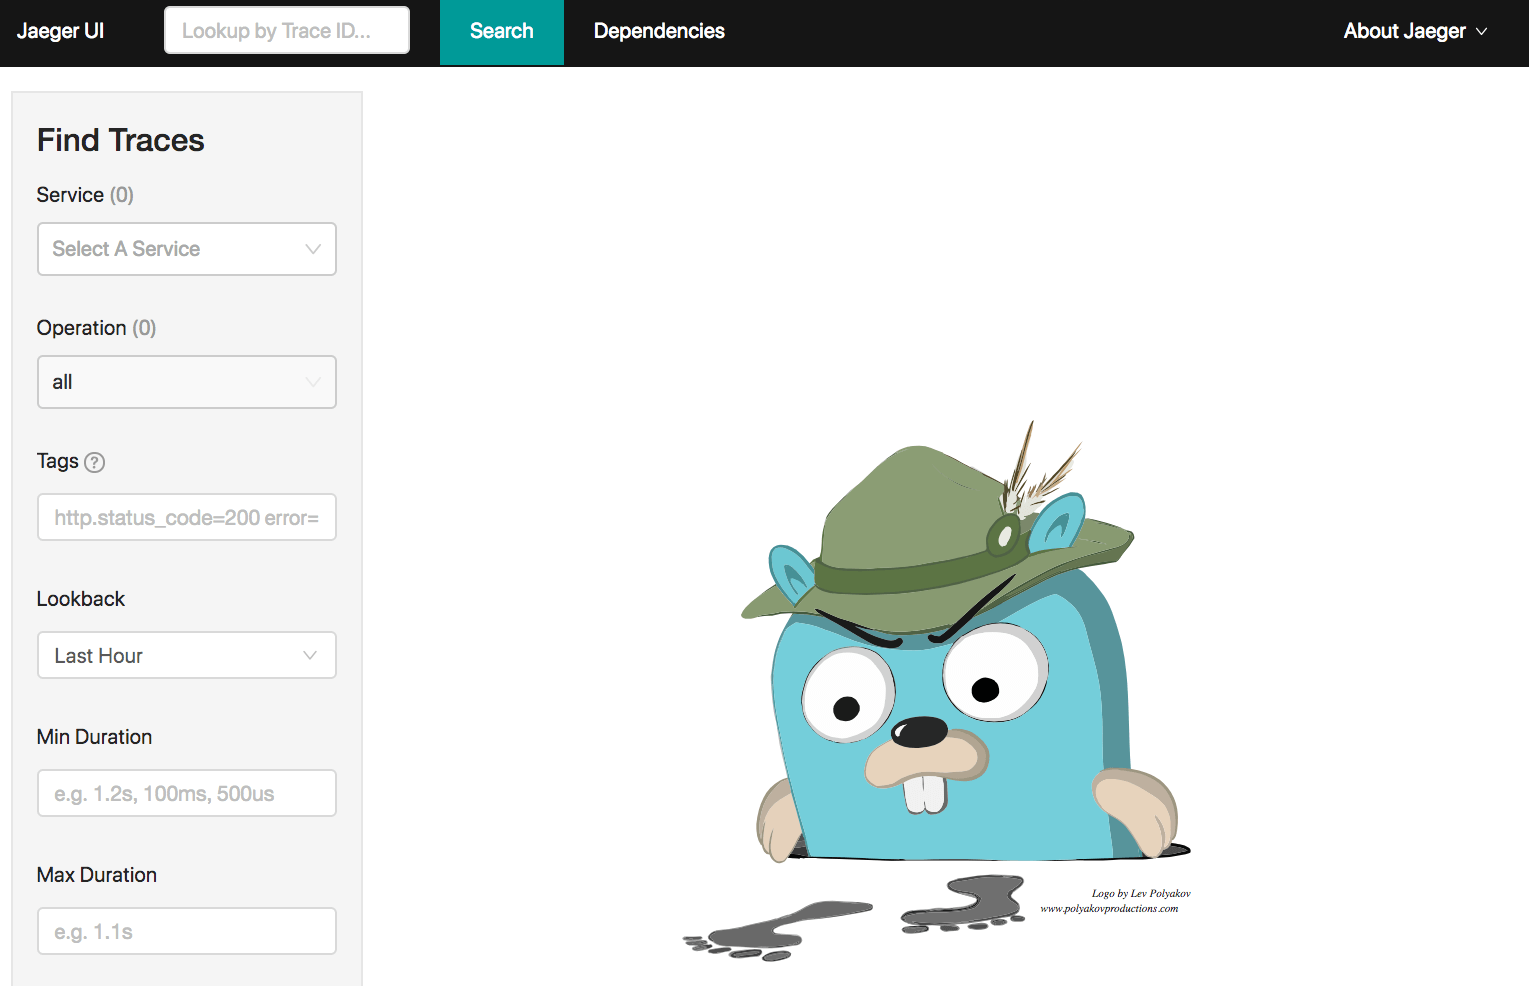
In another article, we dove into OpenTracing and OpenCensus to look more into the mechanics of how tracing works. Although we will be using different backends for our tracing, our demo application will use OpenTracing at its core. These examples will be using the Go Programming Language and the OpenTracing Go API, but you do not need to understand it in order to follow along with the examples.

Continue reading

How to Analyze Web Application Performance Using SolarWinds

September 27, 2018

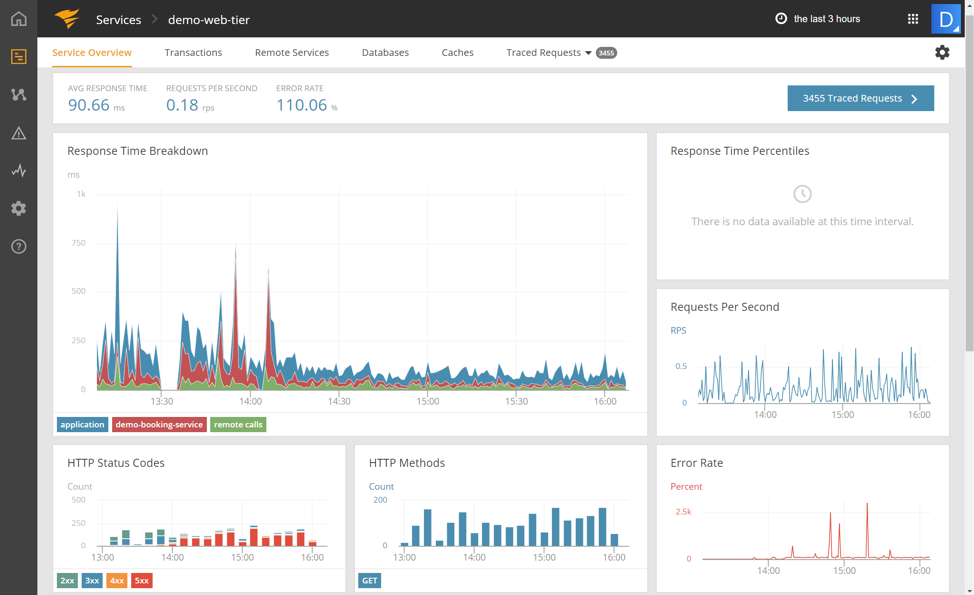
In the push to make the web more accessible, performance is key. Websites are becoming bigger and more complex than ever before, placing a toll on both servers and clients. However, website performance is vital to attracting and keeping users engaged. In this article, we’ll explain why web application performance is important and how you can analyze it and troubleshoot problems using SolarWinds® cloud monitoring solutions.

Continue reading

Intro to OpenTracing and OpenCensus for Distributed Tracing

September 25, 2018

While standard logging and metrics collection approaches give us an understanding of our application from a single vantage point, it is less useful for understanding the flow of execution and data through our applications, especially across network boundaries. Tracing completes our view of application health. There are several standards for distributed tracing, including OpenTracing and Open Census. We’ll describe these two open source standards and show how to use OpenTracing with SolarWinds® AppOptics™.

Continue reading

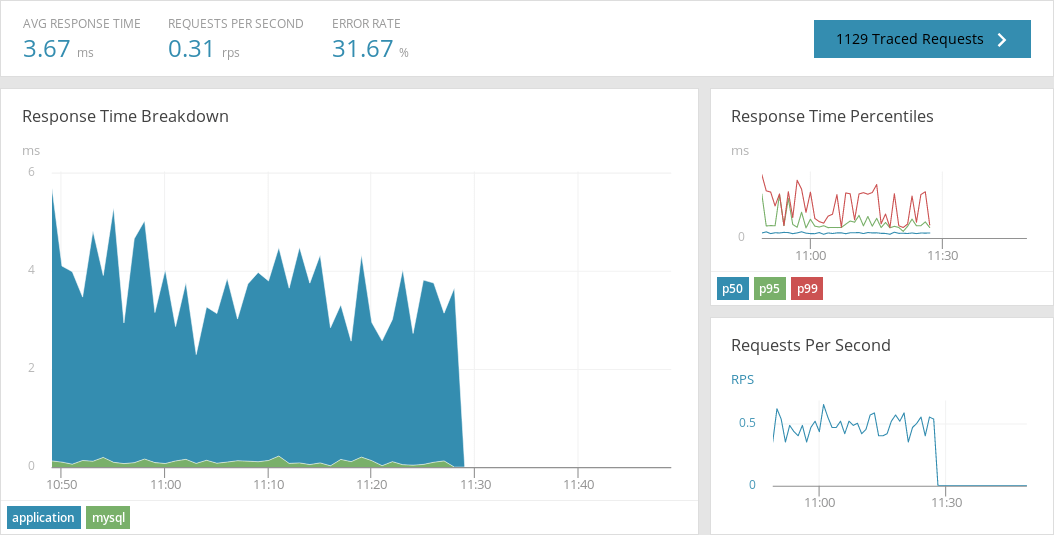
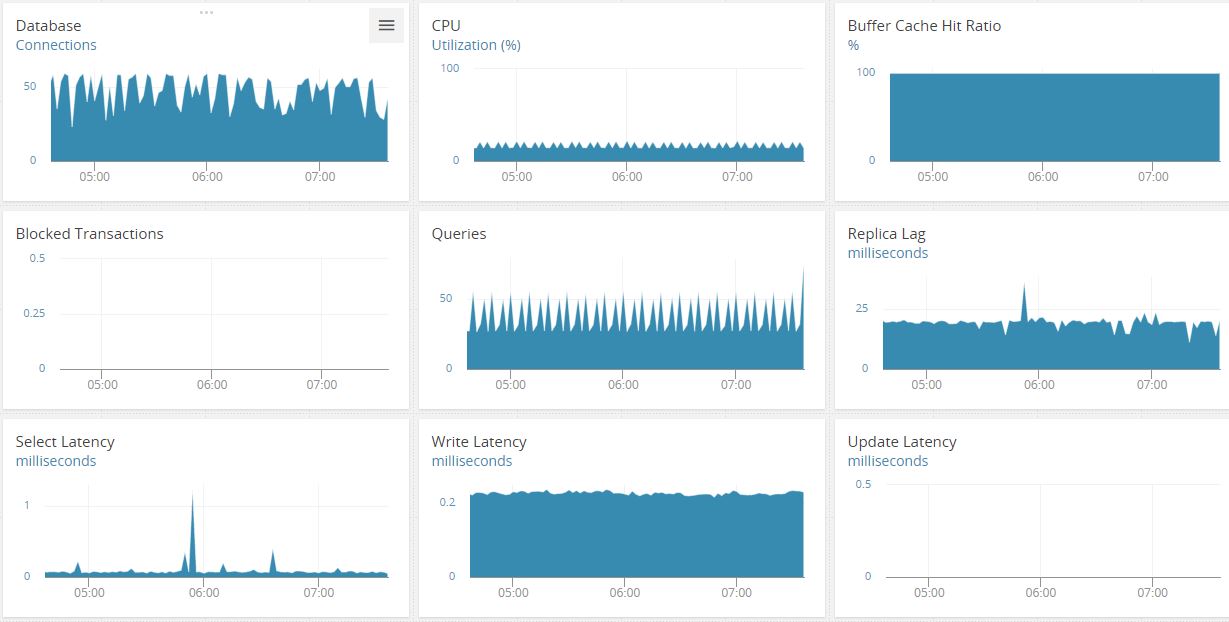
Troubleshooting MySQL Performance Issues with SolarWinds AppOptics

August 22, 2018

You realize your boss is looming by your desk. “The system is down,” he says, as if it’s your fault. “Can you check the database?” “I know,” you say with confidence, “just about to find out.” If you can find the root cause, you’re on the way to getting things up and running again.

Continue reading

Rollbar + Scout: a legit New Relic alternative

March 15, 2018

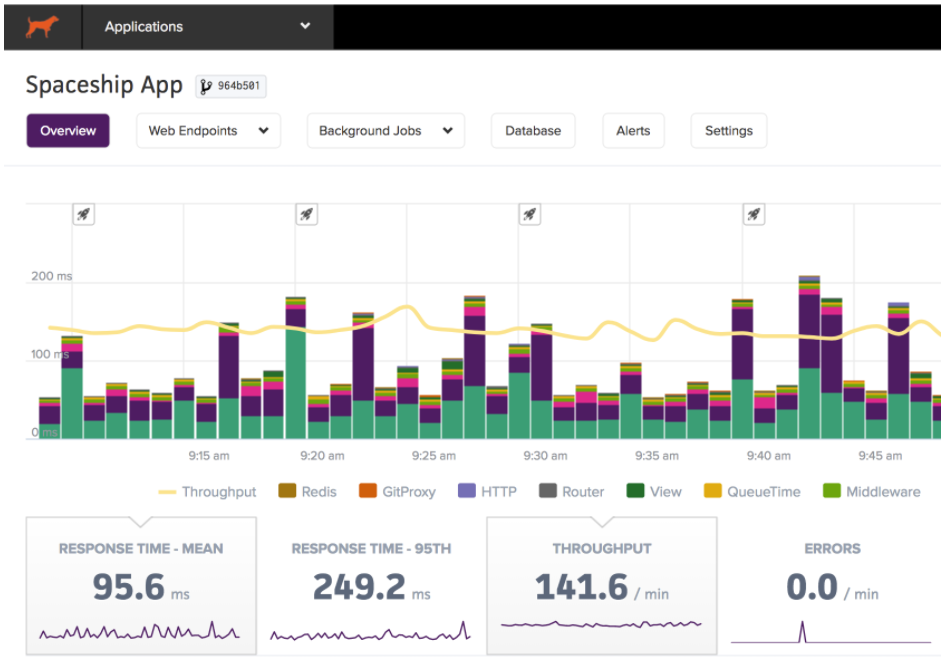
The New Relic price tag goes up dramatically as your server footprint grows. There’s a solution that offers richer features as an alternative to New Relic. When you combine Rollbar (errors) and Scout (performance), you’re choosing two best-of-breed, focused products that actually play well together.

Continue reading