loggly

Best Practices for Client-Side Logging and Error Handling in React

March 21, 2019

Logging is an essential part of development. While working on React projects, logging provides a way to get feedback and information about what’s happening within the running code. However, once an app or website is deployed into production, the default console provides no way to continue benefiting from logs. Since these logs are client-side, all errors experienced by users will be lost in their own browsers. This means that the only way we can find out about errors in our application is by user reports, which often don’t happen; many users will simply leave rather than filling out a bug report.

Continue reading

Monitoring Performance Using SolarWinds Loggly and AppOptics

February 21, 2019

Behind every application, service, and website is a healthy host. In order for DevOps teams to deliver fast, responsive, and stable applications, they need tools to monitor the performance and stability of these hosts. Monitoring helps teams not only identify problems such as high resource usage and errors, but also detect trends and potential changes in performance. In this article, we’ll show how integrating AppOptics with Loggly helps you identify, troubleshoot, and resolve performance problems.

Continue reading

How to Stream Logs from Azure Resources to Loggly

February 15, 2019

When running any production load within Azure, you need to make sure you are always getting the latest info on what is going within your hosted infrastructure. Logs provide a way to record and monitor the systems that we are running and alert us to any potential problems. The Azure Event Hub messaging system has built-in support for streaming logs out of a large variety of Azure-hosted resources, such as VMs, load balancers, and more.

Continue reading

Five Best Practices for Proactive Database Performance Monitoring

February 1, 2019

Database monitoring is a critical part of any application’s maintenance. Finding database issues in time can help the application remain healthy and accessible. Without solid monitoring in place, database outages can go unnoticed until it’s too late and the business is losing money and customers. Like any operational monitoring, databases can be proactively or reactively monitored, with proactive monitoring favored by most people. Proactive monitoring seeks to identify any issues before they become major problems.

Continue reading

Five Tips for Monitoring Your SaaS

January 24, 2019

Page load time is inversely related to page views and conversion rates. While probably not a controversial statement, as the causality is intuitive, there is empirical data from industry leaders such as Amazon, Google, and Bing to back it in High Scalability and O’Reilly’s Radar, for example. As web technology has become much more complex over the last decade, the issue of performance has remained a challenge as it relates to user experience.

Continue reading

Intro to Jenkins X CI/CD for Kubernetes

January 11, 2019

Jenkins X (JX) is an exciting new Continuous Integration and Continuous Deployment (CI/CD) tool for Kubernetes users. It hides the complexities of operating Kubernetes by giving developers a simpler experience to build and deploy their code. You can think of it as creating a serverless-like environment in Kubernetes. As a developer, you don’t need to worry about all the details of setting up environments, creating a CI/CD pipeline, or connecting GitHub to your CI pipeline.

Continue reading

Monitor User Experience Using Client-Side JSON Logs

December 13, 2018

Logging is one of the most useful tools available for developers. It allows them to view and understand the inner workings of their application, even while it’s actively running. It is absolutely essential during development; hunting down bugs and broken points in a project would be impossible without it. However, with the rise of client-side rendering and SPAs, it’s becoming common for the frontend application to handle the vast majority of the user experience.

Continue reading

Benchmarking 5 Popular Load Balancers: Nginx, HAProxy, Envoy, Traefik, and ALB

December 10, 2018

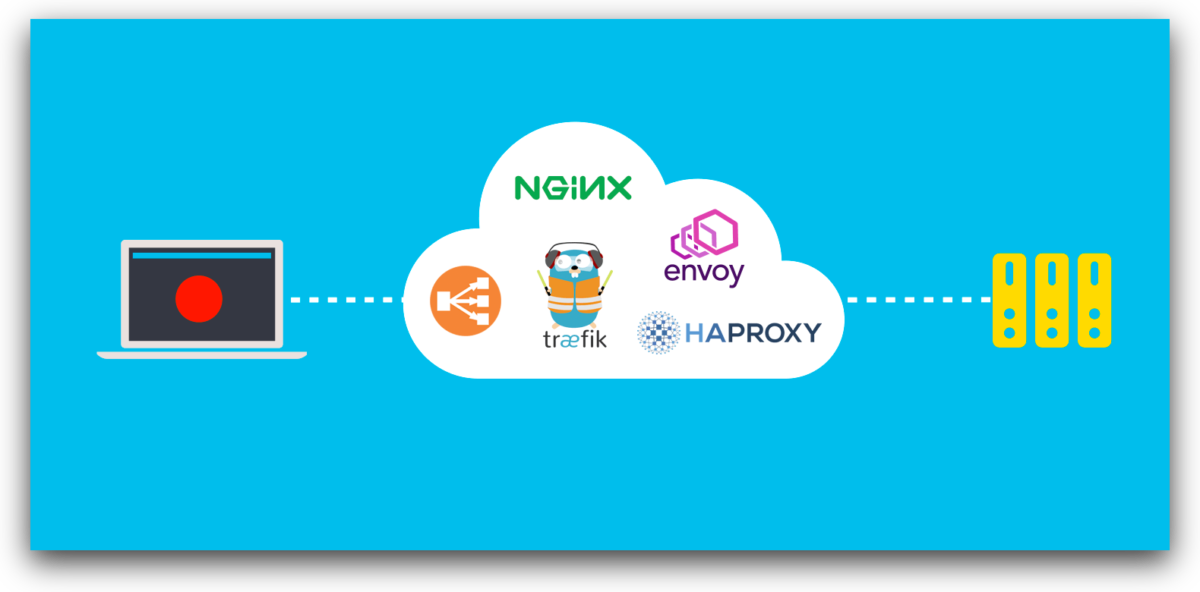
When choosing a load balancer to front your application’s traffic, there are several factors to consider. Achieving the right balance of features, operator usability, and performance depends on the type of software you’re running, how it’s architected, and what platform it’s running on. While often less of a concern than these other factors, it’s still important to understand the performance profiles of these load balancers under different types of load. In this article, we will test five different popular load balancers: NGINX, HAProxy, Envoy, Traefik, and Amazon Application Load Balancer (ALB).

Continue reading

Monitoring Kafka with Loggly

November 26, 2018

Kafka logs contain valuable data on the health of the system. You can identify issues using logs if there is a broker down or if it is generating errors at a high rate. We’ll show you how Loggly can help monitor Kafka logs and alert you to problems.

Continue reading

Analyzing Heroku Router Logs with SolarWinds Loggly

October 23, 2018

What are some common problems that can be detected with the handy router logs on Heroku? We’ll explore them and show you how to address them easily with SolarWinds® Loggly® log management.

Continue reading